PROJECT, DESIGN AND MANAGEMENT (PDM)http://mlsjournals.com/ISSN: 2683-1597 |

|
(2024) Project, Design and Management 6(2), 26-49. doi.org/10.35992/pdm.v6i2.2623.
CRITICAL SUCCESS FACTORS OF WORLD CLASS MANUFACTURING IN THE MEXICAN AUTOMOTIVE INDUSTRY: AN ANALYSIS THROUGH STRUCTURAL EQUATION MODELS
Oscar Antonio Silva Sprock
International Iberoamerican University (Mexico)
oscar.silva@doctorado.unini.edu.mx · https://orcid.org/0000-0001-5069-2541
Roberto Chang López
Universidad Tecnológica Centroamericana/Universidad Nacional Autónoma de Honduras (Honduras)
rchang@unitec.edu · https://orcid.org/0000-0003-1244-2431
FACTORES CRÍTICOS DE ÉXITO DEL WORLD CLASS MANUFACTURING EN LA INDUSTRIA AUTOMOTRIZ MEXICANA: UN ANÁLISIS A TRAVÉS DE MODELOS DE ECUACIONES ESTRUCTURALES
Abstract: World Class Manufacturing (WCM) is an innovative system for comprehensive management of manufacturing operations, characterized by the economic monetization of manufacturing activities and the determination of holistic impact on the organization. WCM enables prioritization of actions based on the economic needs of manufacturing operations, thus directing appropriate resources directly to these needs. This research aims to characterize the critical success factors of WCM and the achievement of objectives in organizations within the automotive sector in Mexico. The study was conducted in Mexico's automotive sector, identified as the country's most important manufacturing industry, representing nearly 4% of the National GDP and 20.5% of the manufacturing GDP. Through literature review and interviews with WCM system experts, six Critical Success Factors (CSFs) were identified, evaluated through 30 constructs. A data collection instrument was applied, subjected to reliability and validity tests through a pilot study. Empirical verification and validation of the instrument were conducted through exploratory factor analysis, confirmatory factor analysis, reliability analysis, and structural equation modeling in a sample of 201 valid surveys directed at experienced WCM professionals. The results indicate that managerial commitment, comprehensive competencies, leadership type, employee involvement, and organizational culture type directly influence the increased benefits of organizations implementing WCM. By understanding the various factors affecting WCM implementation, organizations can develop actions to mitigate risks and strategically plan the necessary short-, medium-, and long-term outcomes and resources.
keywords: World Class Manufacturing, critical success factors , cost deployment, strategic management system, cost deployment.
Resumen: World Class Manufacturing (WCM) es un sistema innovador de gestión integral de operaciones de manufactura, caracterizado en la monetización económica de las actividades de manufactura y la determinación del impacto holístico en la organización. WCM permite priorizar acciones basadas en las necesidades económicas de las operaciones de manufactura y así focalizar los recursos directamente a estas necesidades. El objetivo de este trabajo es caracterizar los factores críticos de éxito del WCM en organizaciones del sector automotriz en México a través de modelos de ecuaciones estructurales. La investigación se llevó a cabo en el sector automotriz de México por caracterizarse esta como la industria más importante de las manufacturas del país. A través de la revisión de literatura y entrevistas con expertos del WCM se identificaron seis CSF, evaluándose por medio de 30 constructos. Se aplicó un instrumento de recolección de datos el cual fue sometido a pruebas de confiabilidad y validez durante una fase piloto de evaluación. Se realizó la verificación y validación del instrumento mediante análisis factorial exploratorio, y modelo de ecuaciones estructurales en una muestra de 201 encuestas a profesionales experimentados en WCM. Los resultados indican que el compromiso gerencial, las competencias integrales, el tipo de liderazgo, el involucramiento y la cultura organizacional influyen directamente en los beneficios de organizaciones que implementan el WCM. Conociendo los CSF del WCM, las organizaciones pueden desarrollar acciones para mitigar los riesgos y poder planificar estratégicamente los resultados y recursos necesarios a corto, mediano y largo plazo.
Palabras clave: World Class Manufacturing, factores críticos de éxito, implementación de costos, sistema estratégico de gestión, despliegue de costos.
Introduction
Changes in consumer behaviors resulting from globalization have motivated companies to engage in competition on a global scale, which has had a direct impact on the production and distribution of products and services (Gonçalves, da Silva, Ferreira, Tecilla, & dos Santos, 2016). Those organizations that still cling to inflexible mass production systems and traditional practices will not be able to keep pace with global changes and demands (Monge and Cruz, 2015; Flynn, Schroeder and Flynn, 1999; Lee and Paiva, 2018).
According to Avella and Vázquez (2005), the need to adopt a new business paradigm based on agility and the ability to adapt to change is manifesting itself in a new era of business. This business era is based on change as its main characteristic, revealing new trends in the management and organization of companies. In order to face the conditions of extreme turbulence and constant market change, the importance of greater flexibility in business management is perceived (Fortunato, 2009). Global competition has generated fundamental changes in the industrial competitive environment (De Felice, Petrillo and Monfreda, 2013).
Although the Manufacturing Management Systems also known as XPS of automotive companies seek to improve efficiency, quality, productivity and flexibility, they can be considered heterogeneous due to their differences in approach, prioritization of improvements and use of resources. According to Goes, Satolo, Ramos, Correa and Martins (2017), among the existing theories, the World Class Manufacturing (WCM) approach proves to be an effective transformation model to eliminate operational losses and support organizations in achieving high levels of performance.
There are several conditions, variables or critical factors that can affect the implementation of WCM in organizations. These factors may be internal or external to the organizations and have not been taken into account to mitigate them, either due to underestimation or lack of knowledge. Some factors may include human, cultural, technological, economic, geographic, political or social factors. One of the most important objectives for managers is quality and efficiency, which can be ensured by identifying and eliminating factors that result in poor performance. Therefore, it is essential to have a better understanding of the critical success factors (CSFs) and how to measure them (Belassi and Tukel, 1996).
In recent years, the automotive industry in Mexico has been characterized as the most important manufacturing industry in the country, boosting and energizing the country's growth and development. According to data from the National Institute of Statistics and Geography (INEGI), in the year 2023, the automotive industry will represent almost 4% of the national GDP and 20.5% of the manufacturing GDP. Due to the relevance of this sector and the benefits mentioned when implementing continuous improvement transformation models, it is common that manufacturing organizations in Mexico seek to adopt WCM as a strategy to improve their economic and productive performance, as well as to reduce the activities that do not add value in their processes.
Based on the above statements, the need to identify the Critical Success Factors (CSFs) that affect the achievement of objectives during the implementation of WCM in manufacturing organizations in the automotive sector in Mexico is revealed. Through knowledge of the various factors that affect WCM implementation, organizations can develop actions to mitigate risks, thus enabling strategic planning of the results and resources needed in the short, medium and long term.
This article explains the steps necessary to develop and statistically validate an instrument to reliably evaluate the degree of implementation of the Critical Success Factors (CSFs) during the execution of the WCM model in companies of the automotive sector in Mexico and a structural equation model identifies and correlates the factors and determines their significance with respect to the benefits.
World Class Manufacturing
World Class Manufacturing or WCM is a model focused on the management of manufacturing operations, based on applied methodologies and performance achieved by the best companies in the world. The model is based on the concepts of Total Quality (TQC), Total Productive Maintenance (TPM), Total Industrial Engineering(TIE) and Just in Time (JIT) (Midor, 2012; De Felice et al., 2013). The main objective of WCM is the continuous improvement in the manufacturing areas to guarantee the quality of the final product. Projects developed under the WCM methodology, aim at eliminating all forms of loss and waste with the ultimate goal of achieving zero accidents, zero waste, zero breakdowns and zero inventories (Fiat Chrysler Automobiles, 2014). Dudek (2016) and Netland (2014) state that WCM is an organization-specific production system, known as XPS, which has been implemented by organizations such as Fiat Chrysler Automobiles and initially by Fiat Corporation in 2005, as well as asserting that the current WCM model was developed by Professor Hajime Yamashina at Kyoto University in Japan. According to Fiat Chrysler Automobiles Corporation (2018) the WCM model is recognized as a common production system among the group of companies that are part of the WCM Association, with the objective of improving manufacturing performance by sharing knowledge and practices of excellence in manufacturing processes.
The WCM Association is a non-profit organization established for the purpose of improving the performance of manufacturing operations through the WCM model. In addition, it is responsible for developing and implementing the best manufacturing technologies, setting manufacturing standards, and increasing the competitiveness and economic benefits of members (Unilever, 2022). In 2021 the list of WCM Association member organizations included: Unilever, Iveco, CNH, FiatChrysler Automobiles, Royal Mail, Whirlpool Corporation, Semperit Corporation, ArcelorMittal, Elica Corporation, Ariston Thermo Group, CNH Industrial, Leonardo, Atlas Copco, Magneti Marelli, Iveco and Saint-Gobain.
According to De Felice et al., (2013), Yamashina (2013), Stellantis Corporation (2021), the WCM model covered by the WCM Association is composed of ten technical pillars and ten managerial pillars, which are usually illustrated inside a temple. The ten technical pillars are: 1) Safety, 2) Cost Deployment, 3) Focused Improvement, 4a) Autonomous Maintenance, 4b) Workplace Organization, 5) Professional Maintenance, 6) Quality Control, 7) Logistics and Customer Service, 8) Early Equipment Management, 9) Personnel Development and 10) Environmental and Energy Management. The ten management pillars are: 1) Management commitment, 2) Clarity of objectives, 3) Roadmap to WCM, 4) Allocation of highly qualified people, 5) Organizational commitment, 6) Organizational competence towards improvement, 7) Time and budget, 8) Level of detail, 9) Level of expansion and 10) Operator motivation.
Critical Success Factors
Critical Success Factors (CSFs) are characteristics, conditions or variables that, if properly maintained or managed, can have a significant impact on the success of a company in a type of industry (Villegas, 2012). According to (Näslund, 2013), apart from some slight variations, CSFs are similar in most quality improvement initiatives and appear to be relatively constant over time. An important finding is that CSFs tend to be more related to how an organization addresses specific factors of the change effort than to the change methods themselves. Management commitment and involvement, as well as organizational culture, are often characterized as fundamentally critical.
Other factors such as type of leadership, human, conceptual and technical competencies that make up the integral competencies are known as key ingredients; that is, essential factors for the successful implementation of any continuous improvement transformation strategy (Mckinley, Manku-Scott, Hastings, French, and Baker, 1997). Therefore, they are commonly found or transferred to different improvement strategies. In fact, the main reason behind the transfer of concepts such as Six Sigma, Lean Manufacturing or other improvement strategies to other organizations is the success they have had in companies such as Motorola and Toyota (Snee and Hoerl, 2003).
According to Soti, Shankar and Kaushal (2010) CSFs were popularized by Rockart (1979). Specifically, CSFs are a series of essential factors for an organization, without which any improvement initiative has a low probability of success. The concept systematically highlights the key areas that management must carefully consider in order to achieve its performance objectives. By understanding the CSFs for implementing a system, an organization can successfully determine the difficulties that critically affect the process, mitigating or avoiding any risks that may contribute to its failure (Yaraghi and Langhe, 2011).
Due to the above, it is important to develop and validate a reliable instrument that allows the collection of data on the CSFs that affect WCM implementation in the specified study sector. This is in agreement with that mentioned by (Alkarney and Albraithen, 2018), who states that by understanding the CSFs for implementing a system, an organization can successfully determine the difficulties that critically affect the process, eliminating or avoiding any problems that may contribute to its failure.
Method
This study used a cross-sectional survey design to collect data on the critical success factors when implementing the WCM model with the objective of supporting the knowledge of organizations in the Mexican automotive sector. Following the classification proposed by Creswell and Plano-Clark (2007), Tashakkori and Teddlie (2010), and Vara (2012), the methodology was adopted with a mixed or quali-quantitative approach. This is because systematic, empirical and critical research processes were applied to support data collection and analysis, both qualitative and quantitative. Consequently, the methodology is considered qualitative as it is based on research and approaches of the WCM model proposed by Yamashina (2000, 2006, 2009 and 2013) and the WCM Association. In addition, it is considered quantitative by collecting data related to WCM experts from various Mexican organizations.
The survey design and validation process was developed in three stages, which are discussed below: A) Instrument design, which consists of construct and indicator definitions, B) Instrument administration, which includes data collection, and C) Statistical analysis for instrument validation, which consists of assumption checking, data analysis using factor analysis, and construct validation.
Instrument Design
The first step in the design of the instrument is to identify the constructs that will be used during the study. Consequently, a detailed review of the literature was carried out by consulting various databases, such as: Scielo, Emerald, Scopus, Proquest, Elsevier, Springer, Ebsco, Nature, Jstor, Sage, Wiley, IEOM Society International, Academic Journals, CORE, Taylor And Francis Group, SPELL, Web Of Science, Semantic Scholar, Scientific Research Publishing. The review covered publications of the last fifteen years focused on the Critical Success Factors of the WCM model in Mexican automotive organizations. Keywords used for the search included World Class Manufacturing, Critical Success Factors, World Class, Yamashina, World Class Association, Total Quality Management, Lean Manufacturing, Total Productive Maintenance.
In the first phase of the instrument design, one hundred and twenty-seven (127) articles were examined to identify the Critical Success Factors (CSFs) with the highest number of mentions in the literature; in total, 9 CSFs were identified. The factors that accounted for more than 75% of the mentions were then selected to be used as the basis for the design of the data collection instrument. In a second phase of the instrument design, the 9 selected CSFs were reviewed with a panel of WCM experts (WCM) composed of seven members of the manufacturing sector, each with more than 7 years of work experience implementing WCM. Once the review with the panel of experts was completed, 6 Critical Success Factors (CSFs) that affect the successful implementation of the WCM were selected.
The selected constructs can be conceptually defined as follows. Integral competencies (IC) comprise technical, human and conceptual skills, fundamental for success in business management. Moreover, the different hierarchical levels of an organization demand varying combinations of these skills (Katz, 1974). The type of leadership (TL) involves characteristics, attitudes and practices that constructively influence the team and the work environment. It encompasses effective communication, empathy, trust, talent development, resilience, ethical leadership and collaboration (Castillo and Romero, 2021; Villarruel, 2021). According to Araneda (2016), positive leadership fosters a healthy work environment, increases team motivation and productivity, and helps retain talent. Managerial commitment (MC) is crucial for the success of organizational change and the promotion of employee involvement, as well as for cultivating an innovative culture (Avlonitis and Karayanni, 2000). In addition, its influence on the formulation of corporate sustainability strategies and the integration of environmentally responsible practices is highlighted (Bravo and Cassano, 2019). Employee Involvement (EI) refers to the active participation and collaboration of organizational members in decision-making processes and operational activities within the workplace. According to Vila, Laguillo and Faura (2020), staff participation can generate benefits in terms of organizational continuity and improve organizational efficiency and effectiveness. Organizational culture (OC) type encompasses shared values, beliefs, and practices that influence employee behavior (Akpa, Asikhia, and Nneji, 2021; Azeem, Ahmed, Haider, and Sajjad, (2021); Drozdowski, 2022). Their understanding and management are crucial for leaders seeking to create an effective work environment (Pujol-Cols, 2018). Benefits (B) relates to the positive results obtained by implementing improvement strategies in organizations, such as efficiency and waste reduction through Lean (Romero, 2020). These benefits are associated with positive actions or outcomes that favor both individuals and the organization (Maciel-Monteon, Limon-Romero, Gastelum-Acosta, Tlapa, Baez-Lopez, & Solano-Lamphar, 2020).
Operationalization of Variables
The six Critical Success Factors (CSFs) represent the latent variables that were studied through the survey. Since these variables cannot be measured directly, it was required to carry out their operationalization (Hernández, Fernández, & Baptista, 2010; and Padua, 2018); that is, to transform subjective variables into directly observable objective variables (Condori, 2015; and Jöreskog, Olsson, & Wallentin, 2016). The final survey was developed from this operationalization process. To achieve this, it was necessary to work from the conceptual definitions of the constructs. Subsequently, a series of indicators were listed for each construction and then at least one element was provided to measure that indicator.
The operationalization processes of the latent variable Integral Competencies (IC) is explained below as an example. IQ can be described by three indicators, such as: WCM Technical Competencies, Human Competencies and Conceptual Competencies. Thus, the indicator labeled " WCM Technical Competencies" is measured through item CI-1; and "Human Competencies" is measured through items CI-2 and CI-3. On the other hand, items CI-4 and CI-5 measure the "Conceptual Competencies" indicator.
The instrument consists of 30 items distributed in 6 constructs. A Likert scale was used to collect the responses to each item, covering a range of perception in an interval of 5 units, from 1 = Never to 5 = Always. The choice of the five-point Likert scale in this specific study is widely accepted and considered appropriate for assessing latent variables through a series of interrelated items (Carpita and Manisera, 2012; Maciel-Monteon et al., 2020)
Content Validation
The survey was reviewed by the panel of seven WCMexperts to verify content validity. The relevance and clarity of the questions, the clear meaning of slang commonly used in the industry, and the time required to complete the entire survey were evaluated. Subsequently, based on the experts' comments, the instrument was modified. Its final structure consisted of five sections: The first section provides a brief introduction to the objectives of the survey, the second section collects information on the professional data of the respondents. The third section evaluates the Critical Success Factors (CSFs) in WCM implementation, and the fourth section contains an analysis of WCM tools. The last section aims to learn about the benefits for companies implementing the WCM model.
Instrument Administration
This study focuses on manufacturing organizations within the automotive sector in Mexico with experience in implementing the WCM model proposed by the WCM Association. The companies were identified through interviews with WCM experts and experienced WCM experts from founding companies of the WCM Association. The target survey participants were employees in middle to senior management positions; i.e., from supervisors at the lower end, to corporate leaders, engineers, managers, CEOs and corporate global vice presidents with WCMexperience. The survey was administered using Google Forms and access was sent via an internet link. A total of 990 links were sent through different digital media such as: Whatsapp, email, Facebook and LinkedIn. The response rate was 22%, with 218 surveys completed with professionals from 11 different companies. The demographic characteristics of the sample were: Professionals of female gender 15.38% and male 77.78%; Type of organizations where the professionals work was Tier1 with 78.63% and Tier2 with 14.53%; Professionals with WCM experience between 1 to 3 years were 7.26%, between 3 to 5 years were 20.94%, between 5 to 7 years were 27.35%, between 7 to 10 years were 20.09% and between 10 to 15 years were 17.52%. The leadership roles of the professionals were Executive Leadership (global operations) with 3.85%, Executive Leadership (local operations) with 25.21%, Functional Area Leaders with 32.91%, Middle Level Leaders with 8.97%, Middle Level Supervisors with 20.94% and Others with 1.28%
Statistical Analysis for the Validation of the Instrument
To validate the instrument, the method used by De La Vega, Baez-Lopez, Limon-Romero, Tlapa, Flores, Rodríguez, and Maldonado-Macías (2020) was followed. The validation of the questionnaire comprises two fundamental tests: reliability and validity. Factor analysis was used to assess the reliability and validity of indirectly observable variables (Rodrigues, Jacinto, Antunes, Amaro, Matos, & Monteiro, 2023). Initially, four crucial aspects in survey validation were checked (Byrne, 2016): the presence of missing data, outliers, compliance with univariate and multivariate normality assumptions, and the presence of multicollinearity.
Factor Analysis
The EFA of the correlation matrix was used to establish the latent factors that explain the variability of the observed variables. A Promax rotation was performed and sample adequacy was assessed using the Kaiser Meyer Olkin index (KMO) and Bartlett's test of sphericity. Non-significant factor loadings were removed and a Confirmatory Factor Analysis (CFA) was performed using SPSS and SmartPLS.
Construct Validity
Convergent, discriminant, and nomological validity were assessed as recommended by Hair, Black, Babin, and Anderson (2014). Cronbach's alpha was estimated to evaluate the internal consistency of the instrument.
Results
In order to avoid missing data, only those surveys that were complete in google forms were included in the analysis. Subsequently, the database was checked for outliers, identifying observations with unique characteristics that clearly differed from the rest (Cohen, G. Cohen, P., West and Aiken, 2002). This procedure was carried out by applying the Mahalanobis distance. A total of 17 surveys identified as outliers were eliminated as they did not meet a conservative level of statistical significance, following Kline's recommendation, with p < 0.001 (Kline, 2016). Thus, the subsequent calculations for the validation of the survey were performed considering only 201 responses. This measure was necessary to improve the normality of the database, since, by meeting this assumption, it was possible to use the maximum likelihood method to extract the factor (Schumacker and Lomax, 2015) following the same methodology used in this research study.
Verification of univariate normality was necessary as an essential, although not sufficient, condition for multivariate normality (De la Vega et al., 2020). To assess the normality of the variable data, it is proposed to rely on skewness and kurtosis; therefore, these two indices were used to measure the univariate normality of each variable in the instrument (De Carlo, 1997, cited by De la Vega et al., 2020). This resulted in absolute values of less than 1.96, corresponding to an error level of 0.05, for skewness and absolute values of less than 3 for kurtosis, as detailed in Table 1. These results corroborate Mardia's (1974) assertion that for a normal distribution, the measure of skewness should have a value of ±1.96 and the standardized kurtosis, a value equal to or less than 3.
Next, multivariate normality was evaluated using Mardia's test, which is based on the normalized value of multivariate kurtosis (Mardia, 1974). This procedure involves comparing Mardia's coefficient for the data under study with a calculated value obtained using the formula p x (p + 2), where p represents the number of variables observed in the model (Khine, 2013). The verification of this assumption was carried out by contrasting the multivariate kurtosis value obtained through the statistical calculations of the virtual program "WebPower - Statistical power analysis online" with the value calculated by means of the proposed formula. With a total of 30 variables in the survey, the calculation yielded a value of 960, thus exceeding the multivariate kurtosis index obtained with WebPower. By meeting the condition that the calculated value is greater than the obtained value (931.404), the assumption of multivariate normality in the data set is also satisfied (De la Vega et al., 2020).
Ultimately, the presence of multicollinearity in the data was examined to rule out the possibility that two or more variables were highly correlated (Hair, Anderson, Tatham and Black, 1998). Two tests were used for this purpose: the first calculated bivariate correlations, since, according to Hair et al. (1998), any pair of variables with a correlation higher than 0.85 should be interpreted as evidence of possible problems. However, this analysis did not reveal such a situation, since the highest bivariate correlation was 0.83. The second test evaluated the variance inflation factors (VIF), which determine whether a variable could be redundant by presenting values greater than 10 (Hair et al., 1998). The VIF results in the study indicated a maximum value of 5.92 (see Table 1). Therefore, based on the two tests performed, it can be concluded that this data set does not present multicollinearity problems.
Table 1
Results of construct validity tests
|
Constructs / Variables |
Asymmetry (Skewness) |
Kurtosis (Kurtosis) |
Inflation Factor (VIF) |
Factor Loading (Factor Loading) |
Eigenvalues (Eigenvalues) |
Composite Reliability (rho_c) |
Crombach's alpha (Crombach Alpha) |
|
|
B |
B1 |
-0.328 |
-0.867 |
0.924 |
4.272 |
0.958 |
0.958 |
|
|
B2 |
-0.092 |
-0.938 |
5.203 |
0.923 |
||||
|
B3 |
-0.233 |
-0.833 |
4.418 |
0.918 |
||||
|
B4 |
-0.167 |
-0.927 |
5.418 |
0.931 |
||||
|
B5 |
-0.270 |
-0.847 |
4.968 |
0.925 |
||||
|
TL |
TL1 |
-0.113 |
-0.681 |
2.858 |
0.866 |
3.571 |
0.901 |
0.901 |
|
TL2 |
-0.211 |
-0.562 |
2.874 |
0.854 |
||||
|
TL3 |
-0.192 |
-0.922 |
2.558 |
0.813 |
||||
|
TL4 |
-0.057 |
-0.808 |
2.511 |
0.839 |
||||
|
TL5 |
-0.019 |
-0.739 |
3.073 |
0.852 |
||||
|
IE |
IE1 |
-0.183 |
-0.700 |
3.166 |
0.858 |
3.745 |
0.917 |
0.917 |
|
IE2 |
-0.046 |
-0.626 |
3.024 |
0.869 |
||||
|
IE3 |
-0.469 |
-0.117 |
3.103 |
0.853 |
||||
|
IE4 |
-0.180 |
-0.261 |
3.101 |
0.872 |
||||
|
IE5 |
-0.194 |
-0.708 |
3.177 |
0.876 |
||||
|
GC |
CG1 |
-0.319 |
-0.289 |
2.020 |
0.754 |
3.297 |
0.873 |
0.871 |
|
CG2 |
-0.347 |
-0.485 |
2.550 |
0.821 |
||||
|
CG3 |
-0.373 |
-0.411 |
2.116 |
0.795 |
||||
|
CG4 |
-0.128 |
-0.629 |
2.473 |
0.835 |
||||
|
CG5 |
-0.048 |
-0.682 |
2.647 |
0.851 |
||||
|
CO |
CO1 |
-0.992 |
0.742 |
4.045 |
0.898 |
4.035 |
0.941 |
0.941 |
|
CO2 |
-0.835 |
0.554 |
3.943 |
0.888 |
||||
|
CO3 |
-0.804 |
0.526 |
3.946 |
0.901 |
||||
|
CO4 |
-0.840 |
0.584 |
3.813 |
0.898 |
||||
|
CO5 |
-1.028 |
0.863 |
4.363 |
0.906 |
||||
|
CI |
CI1 |
-0.211 |
-0.870 |
5.925 |
0.930 |
4.272 |
0.958 |
0.958 |
|
CI2 |
-0.289 |
-0.810 |
5.601 |
0.936 |
||||
|
CI3 |
-0.174 |
-0.930 |
4.773 |
0.919 |
||||
|
CI4 |
-0.254 |
-0.784 |
5.143 |
0.914 |
||||
|
CI5 |
-0.300 |
-0.825 |
5.177 |
0.922 |
||||
Exploratory factor analysis (EFA) of the correlation matrix established the latent factors that explain the variability of the observed variables, and the results were used as an indicator of the validity of each construct analyzed. According to Brown (2015) instrument validity refers to the degree to which the instrument faithfully measures what it purports to measure. In the factor analysis, maximum likelihood estimation was used to extract the factor and Promax oblique rotation. Factor rotation is essential in EFA and is considered by many to be the most crucial tool in the interpretation of EFA (Lorenzo-Seva and Ferrando, 2019). In this study, a Promax rotation was chosen because, in addition to meeting distributional assumptions, it is less likely to generate inappropriate solutions or uncorrelated factors (Raykov and Marcoulides, 2008).
The first step in conducting an EFA involves assessing sample adequacy by calculating the Kaiser Meyer Olkin index (KMO). The KMO test provides a measure to determine whether the partial correlations between variables are small (Romero, 2020). Values above 0.7 are considered regular, meritorious if they are above 0.8 and very good if they are above 0.9 (Kaiser and Rice, 1974). Another method used to verify the feasibility of a factor analysis is Bartlett's test of sphericity. In this context, a factor analysis is feasible as long as the null hypothesis is rejected. This study reported a KMO value of 0.932 and a significant Bartlett's test of sphericity (p <0.001), confirming the applicability of factor analysis.
The second crucial step in an EFA is to eliminate non-significant factor loadings. Hair et al., 2014 suggest that the appropriate value of a factor loading is adjusted to the sample size. The study is based on 201 reliable surveys; therefore, factor loadings greater than 0.4 as recommended by Hatcher, 1994 were considered significant for the analysis. Factor rotation is essential in EFA and is considered by many to be the most important tool in interpreting the results (Hair et al., 2014).
After performing the EFA and applying the promax rotation, 6 constructs composed of a total of 30 variables with significant factor loadings were identified. Similarly, 78.15% of the total variance of the data was explained. It should be noted that the eigenvalues of all the components were greater than 1. To assess the reliability and consistency of our findings, we adopted a confirmatory approach. After performing the EFA, we conducted a Confirmatory Factor Analysis (CFA) using SPSS ® and SmartPLS. Multivariate normality and multicollinearity of the data were assessed, and outliers were checked. No problems related to the first two assumptions were detected and no additional surveys had to be eliminated from the analysis due to the presence of outliers. In summary, subsequent tests were carried out with 201 surveys. Table 2 shows the results of the factor structure of the 30 variables for the total sample.
Table 2
Factorial Structure of Constructs
|
Variables |
Factors |
|||||
|
1 |
2 |
3 |
4 |
5 |
6 |
|
|
CO1 |
0.807 |
|||||
|
CO2 |
0.789 |
|||||
|
CO3 |
0.811 |
|||||
|
CO4 |
0.807 |
|||||
|
CO5 |
0.821 |
|||||
|
IE1 |
0.735 |
|||||
|
IE2 |
0.755 |
|||||
|
IE3 |
0.728 |
|||||
|
IE4 |
0.760 |
|||||
|
IE5 |
0.767 |
|||||
|
B1 |
0.854 |
|||||
|
B2 |
0.852 |
|||||
|
B3 |
0.842 |
|||||
|
B4 |
0.868 |
|||||
|
B5 |
0.856 |
|||||
|
CI1 |
0.866 |
|||||
|
CI2 |
0.876 |
|||||
|
CI3 |
0.844 |
|||||
|
CI4 |
0.836 |
|||||
|
CI5 |
0.851 |
|||||
|
TL1 |
0.749 |
|||||
|
TL2 |
0.729 |
|||||
|
TL3 |
0.661 |
|||||
|
TL4 |
0.704 |
|||||
|
TL5 |
0.727 |
|||||
|
CG1 |
0.569 |
|||||
|
CG2 |
0.674 |
|||||
|
CG3 |
0.633 |
|||||
|
CG4 |
0.698 |
|||||
|
CG5 |
0.725 |
|||||
|
Eigenvalues (Eigenvalues) |
7.58 |
6.34 |
8.68 |
8.41 |
7.14 |
5.00 |
|
% Variance Explained |
39.53 |
13.54 |
9.90 |
7.04 |
4.74 |
3.41 |
|
% Accumulated Variance |
39.53 |
53.07 |
62.97 |
70.00 |
74.74 |
78.15 |
The validity of a measurement model is based on establishing acceptable levels of goodness-of-fit and finding specific evidence of construct validity. According to Hair et al., (2014) the use of three to four indices usually provides adequate evidence of model fit. Kline (2016) indicates that, when attempting to validate a measurement model, it is essential to estimate at least the following model fit indices: the static χ²/df statistic, the root mean square error of approximation (RMSEA), the comparative fit index (CFI), the standardized root mean square residual (SRMR). From these perspectives, it is assumed that investigators should report at least one incremental and one absolute index, in addition to the χ² value and associated degrees of freedom. Therefore, estimation of the χ² value, the CFI or the Tucker-Lewis index (TLI) and the RMSEA will provide sufficient information to evaluate a model. Also, to compare models of different complexities, researchers can incorporate the normalized fit index (NFI).
The results of the confirmatory factor analysis (CFA) indicate an excellent fit, with an X2/df of less than 2.0. In addition, the CFI and TLI values are greater than 0.9, the RMSEA value is less than 0.08 and the SRMR value falls below 0.05. These fit indices confirm the validity of the measurement model. The findings presented in Table 5 reveal that an NFI index of 0.922 indicates an acceptable level of complexity for the initial model. In addition, the R2 values for the main indicators CG, TL, IE, CO, CI and B range between 0.42 and 0.60. These results suggest that these six constructs can be used to evaluate the critical success factors that influence the implementation of WCM in the automotive manufacturing industry in Mexico.
Convergent validity is commonly assessed using the Average Variance Extract (AVE) index. Generally, an AVE value greater than 0.5 indicates good convergent validity, confirming that a set of items are indicators of a specific construct Hair et al., (2014), by converging or sharing a high proportion of variance in common. In our study, Table 3 below presents the AVE values on the main diagonal of the matrix (in bold) for each construct or latent variable. It is important to note that all values are greater than 0.5.
Table 3
Correlations between constructs, average extracted variance and squared correlations squared
|
|
B | GC | CI | CO | IE | TL |
|
B |
0.82a | 0.29 | 0.27 | 0.36 | 0.18 | 0.24 |
|
GC |
0.54 | 0.58 a | 0.04** | 0.12 | 0.01** | 0.04** |
|
CI |
0.52 | 0.20** | 0.82 a | 0.16a | 0.41 | 0.39 |
|
CO |
0.60 | 0.35 | 0.41 | 0.76 a | 0.09 | 0.32 |
|
IE |
0.42 | 0.08** | 0.64 | 0.30 | 0.69 a | 0.06 |
|
TL |
0.49 | 0.21** | 0.62 | 0.56 | 0.24 | 0.65 a |
Note:The values of the main diagonal with the symbol (a) correspond to the Average Variance Extract (AVE). Values in Italic type represent correlations between constructs, significant at p level <= 0.001. Values with the symbol (**) have non-significant values since they have p-values > 0.001. The values above the main diagonal are the squared correlations.
As for the internal consistency of the instrument, it was evaluated by estimating Cronbach's alpha (Cronbach, 1951). This coefficient helps to determine whether the different items or questions of a scale are related. Its values range from 0 to 1, with values closer to 1 indicating greater internal consistency. In this context, George and Mallery (2016) suggest relying on values above 0.7, as lower values could be questionable. According to the results presented in Table 3, all latent variables demonstrate adequate convergent validity, since all Cronbach's alpha values are greater than 0.872. These results were obtained using the SPSS program.
Discriminant validity measures the extent to which a construct is truly different from others. High discriminant validity provides evidence that a construct is unique and captures phenomena different from the others (Martínez-García and Martínez-Caro, 2009). One way to calculate this indicator is to compare the AVE values for two constructs with the squared correlation. The AVE must be greater than the squared correlation to confirm that the two constructs are independent of each other. Table 3 shows that the constructs have an AVE value greater than the squared correlation in all cases. This supports the discriminant validity of the constructs or latent variables.
Finally, nomological validity confirms that correlations between constructs in a measurement theory make sense. The correlation matrix provides information to identify how the constructs are related to each other. The results of the nomological validity test performed in this research are summarized in Table 4, where all the correlations between the constructs are positive and significant except for 3 cases where they were not significant because the p was greater than or equal to 0.001: CG-CI, CG-IE and CG-TL.
TABLE 4
Results of the Initial Structural Equation Model (SEM) Proposed
|
Trajectory Analysis |
Parameter estimates |
Standard errors |
T-values |
P-values |
Results |
| B |
1.178 |
0.142 |
8.310 |
0.000 |
Accepted |
| GC |
0.464 |
0.090 |
5.185 |
0.000 |
Accepted |
| CI |
1.206 |
0.142 |
8.505 |
0.000 |
Accepted |
| CO |
0.838 |
0.109 |
7.711 |
0.000 |
Accepted |
| IE |
0.544 |
0.078 |
6.984 |
0.000 |
Accepted |
| TL |
0.790 |
0.114 |
6.941 |
0.000 |
Accepted |
| CG <-> B |
0.399 |
0.072 |
5.538 |
0.000 |
Accepted |
| IQ <-> B |
0.615 |
0.101 |
6.086 |
0.000 |
Accepted |
| IC <-> GC |
0.149 |
0.060 |
2.488 |
0.014 |
Rejected |
| CO <-> B |
0.597 |
0.090 |
6.659 |
0.000 |
Accepted |
| CO <-> CG |
0.220 |
0.054 |
4.047 |
0.000 |
Accepted |
| CO <-> CI |
0.408 |
0.082 |
4.951 |
0.000 |
Accepted |
| IE <-> B |
0.337 |
0.067 |
5.007 |
0.000 |
Accepted |
| IE <-> CG |
0.042 |
0.040 |
1.065 |
0.288 |
Rejected |
| IE <-> CI |
0.520 |
0.077 |
6.791 |
0.000 |
Accepted |
| IE <-> CO |
0.203 |
0.055 |
3.717 |
0.000 |
Accepted |
| TL <-> B |
0.471 |
0.084 |
5.594 |
0.000 |
Accepted |
| TL <-> CG |
0.128 |
0.050 |
2.555 |
0.011 |
Rejected |
| TL <-> CI |
0.608 |
0.091 |
6.655 |
0.000 |
Accepted |
| TL <-> CO |
0.457 |
0.075 |
6.088 |
0.000 |
Accepted |
| TL <-> IE |
0.157 |
0.053 |
2.967 |
0.003 |
Accepted |
Note. Values in italic type represent rejected results with P-values >=0.001.
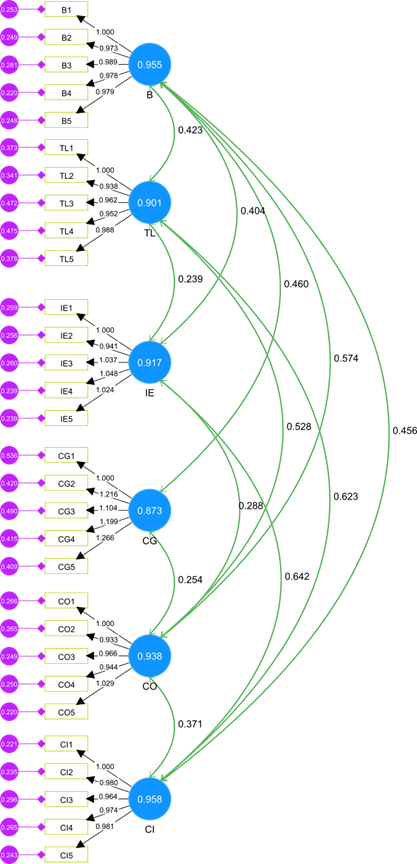
In order to propose a final structural equation model that describes the relationships between the significant variables, the relationships between the variables CI - CG, IE - CG and TL - CG were eliminated, since they did not show statistical significance. Figure 1 represents the final proposed model that includes only the significant variables, while Table 5 presents their Fit Indices.
Table 5
Final Model Fit Indices for Model Measuremen
|
Statistical Adequacy of Fit |
Recommended Values for a Satisfactory Model Fit |
References |
Initial Model |
Final Model |
|
X2/df |
|
|
1.120 |
1.133 |
|
TLI |
|
|
0.990 |
0.989 |
|
IFC |
|
|
0.991 |
0.990 |
|
RMSEA |
|
|
0.024 |
0.026 |
|
SRMR |
|
|
0.039 |
0.070 |
|
NFI |
|
|
0.922 |
0.921 |
Figure 1
Final Proposed Structural Equation Model (SEM)
Discussion and Conclusions
The purpose of this research was to determine the critical success factors (CSFs) in the implementation of the WCM model in the automotive sector in Mexico, through the creation and evaluation of a data collection instrument (survey). The design of the instrument included the process of operationalization of variables, which allows direct measurement of unobservable variables through measurable indicators, as is the case of CSFs (Padua, 2018). Construct validity was assessed using the EFA, confirming that the items measured truly reflect the theoretical latent variables they were intended to measure. Finally, the study evaluated the three types of construct validity (convergent, discriminant and nomological), and each yielded a statistically satisfactory result.
During the validation of the instrument, the responses obtained were analyzed, making it possible to evaluate the perceived level of implementation of CSFs in the implementation of the WCM model in the sector studied. Table 6 presents the overall mean and standard deviation for each factor used to investigate the level of CSF implementation perceived by respondents.
Table 6
Critical Success Factor Ratings
|
Construct |
Variable |
Media |
Standard Deviation (SD) |
Average Mean |
Average SD |
Range |
| Integral competencies (IC) |
CI-1 |
3.23 |
1.20 |
3.237 |
1.182 |
6 |
|
CI-2 |
3.20 |
1.17 |
||||
|
CI-3 |
3.23 |
1.20 |
||||
|
CI-4 |
3.28 |
1.16 |
||||
|
CI-5 |
3.24 |
1.18 |
||||
| Type of leadership (TL) |
TL-1 |
3.25 |
1.08 |
3.317 |
1.074 |
4 |
|
TL-2 |
3.28 |
1.02 |
||||
|
TL-3 |
3.39 |
1.10 |
||||
|
TL-4 |
3.35 |
1.09 |
||||
|
TL-5 |
3.31 |
1.08 |
||||
| Management Commitment (GC) |
CG-1 |
3.62 |
0.90 |
3.583 |
0.900 |
2 |
|
GC-2 |
3.52 |
0.86 |
||||
|
GC-3 |
3.61 |
0.92 |
||||
|
GC-4 |
3.53 |
0.92 |
||||
|
GC-5 |
3.63 |
0.90 |
||||
| Employee Involvement (EI) |
IE-1 |
3.38 |
1.00 |
3.320 |
1.043 |
3 |
|
AR-2 |
3.31 |
1.06 |
||||
|
AR-3 |
3.37 |
1.03 |
||||
|
AR-4 |
3.28 |
1.04 |
||||
|
AR-5 |
3.26 |
1.08 |
||||
| The type of organizational culture (OC) |
CO-1 |
3.80 |
1.05 |
3.745 |
1.026 |
1 |
|
CO-2 |
3.75 |
1.00 |
||||
|
CO-3 |
3.69 |
1.02 |
||||
|
CO-4 |
3.70 |
1.00 |
||||
|
CO-5 |
3.80 |
1.06 |
||||
| Benefits (B) |
B-1 |
3.28 |
1.20 |
3.245 |
1.190 |
5 |
|
B-2 |
3.18 |
1.18 |
||||
|
B-3 |
3.26 |
1.19 |
||||
|
B-4 |
3.26 |
1.19 |
||||
|
B-5 |
3.23 |
1.19 |
The average values range from 3.245 to 4.745, with an average standard deviation of 1.07, indicating a good level of WCM model implementation. The information revealed that the CSFs Organizational Culture Type (OC) and Managerial Commitment (MC), with values of 3.745 (±1.026) and 3.583 (±0.9) respectively, were considered the most relevant factors in the implementation of the WCMmodel. In third and fourth place were the employee involvement factor (EI) and the leadership type (TL), with values of 3.32 (±1.043) and 3.317 (±1.074) respectively. Finally, respondents perceived CSF Benefits (B) and comprehensive competencies (CI) to have the least influence during WCM model implementation, with values of 3.245 (±1.19) and 3.237 (±1.182) respectively. It is important to note that the six factors were considered by the respondents as "always" and "almost always", that is, as elements usually present in the implementation of this type of improvement projects.
The research results revealed that Organizational Culture (OC) emerges as the most prominent Critical Success Factor (CSF) compared to the other factors analyzed. Organizational culture has proven to be a fundamental element for the successful implementation of continuous improvement processes (Akpa et al., 2021). Characteristics such as cohesion, shared values, and adaptability stand out in organizations that have achieved successful implementation in previous studies Quinn and Cameron (2019). The advantage of a strong CO is reflected in goal alignment, proactive behaviors, and reduced resistance to change (Paais and Pattiruhu, 2020). These findings support the importance of Organizational Culture in the context of WCM implementation in the Mexican automotive sector.
Management Commitment (MC) stands out as a very important CSF, according to the ranking derived from the factor analysis, being an essential component for the success of WCM implementation. Distinctive features of effective managerial engagement include appropriate resource allocation, active leadership, and consistent involvement in project phases (Bravo and Cassano, 2019). Previous studies have shown that top management commitment creates an environment conducive to the adoption of transformational practices, generating an organizational culture aligned with the principles of the model (Vega, Fuentealba, & Patiño, 2016). Observed benefits range from improved operational efficiency to a boost in employee motivation and engagement (Flores and Cervantez, 2018). These results underline the relevance of Management Commitment in the success of WCM initiatives in the Mexican automotive sector.
According to the respondents the next relevant factor of the research was Employee Involvement (EI), being one of the essential components to achieve success in WCMimplementation. The active participation of employees in continuous improvement processes, the generation of innovative ideas and organizational adaptability to operational changes are elements that create an environment conducive to innovation and organizational flexibility, thus supporting the success of transformation models (Tuuli and Rowlinson, 2009). Other key features of effective engagement encompass open communication, encouragement of active participation, and promotion of feedback between employees and management (Pujol-Cols, 2018). These aspects not only strengthen internal collaboration, but also contribute to building a dynamic organizational culture that is receptive to continuous improvement (Vila et al., 2020). According to Gonzalez, Pozo, Grob and Quijada (2021) positive interaction between employees and management not only benefits the implementation of efficient processes, but also enhances the organization's ability to adapt and thrive in a dynamic environment. The benefits range from increased creativity and identification of improvement opportunities to a strengthened sense of employee ownership and commitment.
In the context of the implementation of the WCM model in automotive organizations in Mexico, the Leadership Type (TL) emerges as one of the most outstanding CSFs. The literature on leadership reveals its breadth and complexity, generating considerable interest and recognizing its fundamental role in organizations (Jiménez, 2010). The emotional intelligence approach highlights the relevance of understanding and managing emotions to achieve effective leadership results (Goleman, Boyatzis and Mckee, 2002). Previous studies have identified diverse leadership styles, including visionary and personal, particularly evident in female leaders, highlighting their ability to lead change (Changúan, Parrales, Higuera, & Cadena, 2020). In addition, the importance of styles that balance well-being and organizational objectives is highlighted (Campos, Morcillo, Rubio and Celemín, 2020). Authentic leadership, characterized by faithfulness and transparency, has gained attention and is associated with virtuous organizations (Villafuerte and Lupano, 2020). Leadership, shared by leaders and followers, is presented as essential in continuous improvement initiatives, as it influences the success of such initiatives (Kuei, Madu and Lin, 2001). According to Eckes (2001) improvement initiatives fail due to weak project leadership and management skills, so commitment, effective communication, project participation, selection and evaluation ensure the achievement of goals and objectives.
Integral competencies (IC) stands out as the CSF with the lowest weighting in the implementation of the WCM model according to the respondents. Organizational competencies, fundamental to success, evolve over time and require commitment to continuous learning (Khandii, 2021). Previous studies underline the essentiality of technical, conceptual and human competencies for successful leadership (Robbins and Coulter, 2004 and Koontz, Weihrich and Cannice, 2014). While conceptual competencies involve strategic thinking, human competencies focus on interpersonal skills crucial to assessing, guiding and leading teams (Vitaza, 2020). Effective communication, adaptability and commitment are key to human competencies, fundamental for a healthy work environment and achievement of objectives (Van-der-Hofstadt-Román and Gómez-Gras, 2006). IQ, enriched by skills in strategic management, teamwork, effective communication and decision making, is presented as a fundamental pillar for successful, competitive and transformational leadership (Cavagnaro and Carvajal, 2020; Araneda-Guirriman, Neumann-González, Pedraja-Rejas, and Rodríguez-Ponce, 2016).
This research study succeeded in meeting the objective of examining the relationship between the Critical Success Factors of WCM and the achievement of the objectives, as well as its effective implementation in the analyzed sector. However, there are two fundamental limitations to this work. First, the survey focused exclusively on the automobile manufacturing sector of the Mexican manufacturing industry. Nevertheless, it is considered that the instrument could be applied in other industrial sectors in different countries with conditions similar to those in Mexico. However, it is recommended that the validity of the instrument be verified and adjusted if necessary before using it in sectors other than those for which it was originally designed and validated. Second, the Critical Success Factors considered for the development of the instrument were derived from a comprehensive literature review and evaluation by WCM experts in the automotive sector. Therefore, it is likely that there are Critical Success Factors that influence other sectors with different levels of maturity in manufacturing processes and technology if different industrial areas are analyzed.
As future research possibilities, the authors are interested in exploring the structural relationships between WCM implementation and the benefits obtained by developing them in other industrial sectors. The survey developed in this study can be used in other manufacturing industries with similar characteristics; therefore, the authors will seek to apply and validate the instrument in other manufacturing sectors manufacturing sectors in the nation with the objective of supporting, through the WCM model, the strengthening of industrial competitiveness.
References
Akpa, V. O., Asikhia, O. U., y Nneji, N. E. (2021). Organizational culture and organizational performance: A review of literature. International Journal of Advances in Engineering and Management (IJAEM), 3(1), 361-372.
Alkarney, W. y Albraithen. M. (2018). Are critical success factors always valid for any case? A contextual perspective. IEEE Access, 6, 63496-63512. https://doi.org/10.1109/ACCESS.2018.2876792
Araneda-Guirriman, C. A., Neumann-González, N. A., Pedraja-Rejas, L. M., y Rodríguez-Ponce, E. R. (2016). Análisis Exploratorio de las Percepciones sobre los Estilos de Liderazgo de los Directivos Universitarios en el Norte de Chile. Formación Universitaria, 9(6). http://dx.doi.org/10.4067/S0718-50062016000600013
Avella Camarero, L., y Vázquez Bustelo, D. (2005). ¿Es la fabricación ágil un nuevo modelo de producción? Universia Business Review, 6, 94-107. https://www.redalyc.org/articulo.oa?id=43300608
Avlonitis, G. J., y Karayanni, D. A. (2000). The Impact of Internet Use on Business-to-Business Marketing: Examples from American and European Companies. Industrial Marketing Management, 29(5), 441-459. https://doi.org/10.1016/S0019-8501(99)00071-1
Azeem, M., Ahmed, M., Haider, S., & Sajjad, M. (2021). Expanding competitive advantage through organizational culture, knowledge sharing and organizational innovation. Technology in Society, 66, 101635. https://doi.org/10.1016/J.TECHSOC.2021.101635
Belassi, W., & Tukel, O. I. (1996). A new framework for determining critical success/failure factors in projects. International Journal of Project Management, 14, 141-151. https://doi.org/10.1016/0263-7863%2895%2900064-X
Bravo, L. N. J., y Cassano, D. P. P. G. (2019). Estrategias para aumentar el compromiso organizacional en el área de ventas de una empresa de la industria cosmética y cuidado personal. INNOVA Research Journal, 4(3.1), 184–192. https://doi.org/10.33890/innova.v4.n3.1.2019.1087
Brown, T. A. (2015). Confirmatory Factor Analysis for Applied Research (2ª Ed.). Guilford Publications.
Byrne, B. M. (2016). Structural Equation Modeling With AMOS: Basic Concepts, Applications, and Programming (3ª Ed.). Routledge. https://doi.org/10.4324/9781315757421
Campos-Blázquez, J. R., Morcillo, P., Rubio-Andrada, L., y Celemín-Pedroche, M. S. (2020). Intrapreneurship Initiative Based on an Internal Ideation Contest in the Public Sector: The Case of Madrid City Hall (Spain). In J. G. L. Dantas & L. C. Carvalho (Eds.), Handbook of Research on Approaches to Alternative Entrepreneurship Opportunities (pp. 154–180). IGI Global.
Carpita, M., y Manisera, M. (2012). Constructing indicators of unobservable variables from parallel measurements. Electronic Journal of Applied Statistical Analysis, 5, 320–326. http://siba-ese.unisalento.it/index.php/ejasa/article/view/12146
Cavagnaro, C., & Carvajal, C. (2020). El Liderazgo Transformacional en la Gestión Educativa en la Unidad Educativa República de Francia de Guayaquil. 593 Digital Publisher CEIT, 6(1), 132-149. https://doi.org/10.33386/593dp.2021.1.457
Castillo, J., y Romero, I. (2021). Competencias directivas de la gestión del cambio en institutos de educación superior tecnológico público. Revista en Gobierno y Gestión Pública, 8(2), 10-32. https://doi.org/10.24265/iggp.2021.v8n2.02
Changúan, O. M. P., Parrales, R. E. C., Higuera, P. M. G., y Cadena, H.Y. P. (2020). Estilos de liderazgo aplicados a las pymes. Pro Sciences: Revista De Producción, Ciencias E Investigación, 4(30), 55–61. https://doi.org/10.29018/issn.2588-1000vol4iss30.2020pp55-61
Cohen, J., Cohen, P., West, S.G., y Aiken, L.S. (2002). Applied Multiple Regression/Correlation Analysis for the Behavioral Sciences. (3ª Ed.). Routledge. https://doi.org/10.4324/9780203774441
Condori, T. P. (2015). Operacionalización de las variables psicológicas. Revista de Investigacion Psicologica, 13, 63-78.
Creswell, J., y Plano-Clark, V. (2007). Designing and Conducting Mixed Methods Research. Thousand Oaks, CA: Sage. Organizational Research Methods, 12(4), 801-804. https://doi.org/10.1177/1094428108318066
Cronbach, L. J. (1951). Coefficient alpha and the internal structure of tests. Psychometrika, 16, 297–334. https://doi.org/10.1007/BF02310555
De La Vega M., Baez, Y.L., Limon, J. R., Tlapa, D., Flores, D. L., Rodriguez, M. B. y Maldonado, A.M. (2020). Lean Manufacturing Critical Success Factors for the Transportation Equipment Manufacturing Industry in Mexico. IEEE Access, 8, 168534-168545. https://doi.org/10.1109/ACCESS.2020.3023633
De Carlo, L. T. (1997). On the meaning and use of kurtosis. Psychological Methods, 2, 292-307. https://doi.org/10.1037/1082-989X.2.3.292
Drozdowski, G. (2022). The empirical analysis of human capital competences on the example of company executives. Ekonomia I Prawo. Economics and Law, 21(2), 355–367. https://doi.org/10.12775/EiP.2022.019
Dudek, M. (2016, 28-30 de noviembre). Generation of the World Class Manufacturing systems. In Carpathian Logistics Congress, Zakopane, Poland, 2016. https://www.confer.cz/clc/2016/2721-generations-of-the-world-class-manufacturing-systems
Eckes, G. (2001). The Six Sigma Revolution: How General Electric and Others Turned Process into Profits. Wiley.
Felice de, F. y Petrillo, A. (2015). Optimization of Manufacturing System through World Class Manufacturing. IFAC-PapersOnLine, 48(3), 741-746. https://doi.org/10.1016/j.ifacol.2015.06.171
Felice de, F. y Petrillo, A., y Monfreda, S. (2013). Improving Operations Performance with World Class Manufacturing Technique: A Case in Automotive Industry. InTech. https://doi.org/10.5772/54450
Fiat Chrysler Automobiles (2018). FCA 2017 Sustainability Report. https://www.stellantis.com/content/dam/stellantis-corporate/sustainability/csr-disclosure/fca/fca_2017_sustainability_report.pdf
Flores, S. E., y Cervantez, O. D. (2018). Influencia del compromiso organizacional sobre el aprendizaje organizacional de los docentes de la universidad pedagógica nacional “Francisco Morazán”. Paradigma: Revista De Investigación Educativa, 23(36), 53-72. https://doi.org/10.5377/paradigma.v23i36.6487
Flynn, B. B., Schroeder, R. G., y Flynn, E. James (1999). World class manufacturing: an investigation of Hayes and Wheelwright's foundation. Journal of Operations Management, 17, 249-269. https://doi.org/10.1016/S0272-6963(98)00050-3
Fortunato, V. (2009). Lavorare in FIAT-SATA: partecipazione e coinvolgimento dei lavoratori nel modello WCM. Quaderni Di Sociologia, 53(51), 87-110. https://doi.org/10.4000/qds.746
George, D., y Mallery, P. (2016). IBM SPSS Statistics 23 Step by Step: A Simple Guide and Reference (14ª Ed.). Routledge. https://doi.org/10.4324/9781315545899
Goes, G.A., Satolo, E.G., Queiroz, T.R., Bernardo, C.H., y Raymundo, J.D. (2017). Social Network Analysis on Lean Production and WCM: how are associated in the literature?. Independent Journal of Management & Production (IJM&P), 8(2), 596. https://doi.org/10.14807/ijmp.v8i2.596
Goleman, D.J., Boyatzis, R.E., y Mckee, A. (2002). The emotional reality of teams. Journal of Organizational Excellence, 21, 55-65. https://doi.org/10.1002/npr.10020
Gonçalves, P.S., Silva da, D., Ferreira, L.F., Tecilla, M.C., y Santo dos, L.M. (2016). Proposition Factor Model of World Class Manufacturing in Brazilian Enterprises. Independent Journal of Management & Production (IJM&P), 7(2), 336. https://doi.org/10.14807/ijmp.v7i2.336
González, E., Pozo, J., Grob, F., y Quijada, C. (2021). Asociación entre eventos adversos en el cuidado de enfermería, cultura de seguridad y complejidad de pacientes en un hospital chileno. Ciencia y Enfermería, 27(27). https://doi.org/10.29393/ce27-27aeec40027
Hair, J.F., Anderson, R.E., Tatham, R.L., y Black, W.C. (1998). Multivariate Data Analysis. (5ª Ed.). Prentice Hall.
Hair, J. F., Black, W. C., Babin, B. J., y Anderson, R. E. (2014). Multivariate Data Analysis. (7ª Ed.). Pearson.
Hatcher, I. (1994). A Step-By-Step Approach to Using the SAS System for Factor Analysis and Structural Equation Modeling. SAS Institute.
Hernández Sampieri, R., Fernández Collado, C., y Baptista, M. P. (2010). Metodología de la investigación (5ª Ed.). McGraw-Hill.
Jiménez, I. (2010). ¿Por qué es esencial discutir acerca del liderazgo en la gestión escolar?. Revista Electrónica Educare, 14(1), 59-66. https://doi.org/10.15359/ree.14-1.5
Jöreskog, J. R., Olsson, U., y Wallentin, F. (2016). Multivariate Analysis With LISREL. Springer International Publishing.
Khandii, O. (2021). The Formation and Development of Employee Competencies in Modern Digital World (According to the Results of an Expert Survey). Business Inform 10, 207–214. https://doi.org/10.32983/2222-4459-2021-10-207-214
Kaiser, H.F. y Rice, J. (1974) Little Jiffy, Mark Iv. Educational and Psychological Measurement, 34, 111-117. https://doi.org/10.1177/001316447403400115
Katz, R.L. (1974). Skills of an Effective Administrator. Harvard Business Review, 52(5), 90-102. https://hbr.org/1974/09/skills-of-an-effective-administrator
Khine, M. S. (2013). Application of Structural Equation Modeling in Educational. Sense Publishers Rotterdam. https://doi.org/10.1007/978-94-6209-332-4
Kline, R. (2016). Principles and Practice of Structural Equation Modeling. The Guilford Press.
Koontz, H., Weihrich, H., y Cannice, M. (2014). Administración. Una perspectiva global y empresarial. (14ª Ed.). McGraw Hill.
Kuei, C., Madu, C. N., y Lin, C. (2001). The relationship between supply chain quality management practices and organizational performance. International Journal of Quality & Reliability Management, 18(8), 864-872. https://doi.org/10.1108/EUM0000000006031
Lee, P.C. y Paiva, E.L. (2018), How do national cultures impact the operations strategy process?, International Journal of Operations & Production Management, 38(10), 1937-1963. https://doi.org/10.1108/IJOPM-03-2017-0145
Lorenzo-Seva, U., y Ferrando, P. (2019, junio 19). Robust Promin: un método para la rotación de factores de diagonal ponderada. LIBERABIT. Revista Peruana De Psicología, 25(1), 99 - 106. https://doi.org/10.24265/liberabit.2019.v25n1.08
Maciel-Monteon, M., Limon-Romero, J., Gastelum-Acosta, C., Tlapa, D., Baez-Lopez, Y., y Solano-Lamphar, H. A. (2020). Measuring Critical Success Factors for Six Sigma in Higher Education Institutions: Development and Validation of a Surveying Instrument. IEEE Access, 8, 1813-1823. https://doi.org/10.1109/ACCESS.2019.2962521
Mardia, K. V. (1974). Applications of some measures of multivariate skewness and kurtosis in testing normality and robustness studies. Sankhyā, Indian Journal of Statistics. Series B, 36(2), 115–128.
Martínez-García, J. A., y Martínez-Caro, L. (2009). La validez discriminante como criterio de evaluación de escalas: ¿teoría o estadística? Universitas Psychologica, 8(1), 27-36. Pontificia Universidad Javeriana, Bogotá, Colombia. http://www.scielo.org.co/scielo.php?script=sci_arttext&pid=S1657-92672009000100002
McKinley, R. K., Manku-Scott, T., Hastings, A. M., French, D. P., y Baker, R. (1997, January). Reliability and validity of a new measure of patient satisfaction with out of hours primary medical care in the United Kingdom: Development of a patient questionnaire. British Medical Journal, 314 (7075), 193.
Midor, K. (2012). World Class Manufacturing – characteristcs and implementation in an automotive enterprise. Zeszyty Naukowe / Akademia Morska w Szczecinie, 32(104), 42-47.
Monge, C., y Cruz, J. (2015). Manufacturing and continuous improvement performance level in plants of México; a comparative analysis among large and medium size plants. European Journal of Business and Economics, 10, (2) https://doi.org/10.12955/EJBE.V10I2.696
Näslund, D. (2013). Lean and six sigma – critical success factors revisited. International Journal of Quality and Service Sciences, 5, 86-100. https://doi.org/10.1108/17566691311316266
Netland, T. H. (2016). Critical success factors for implementing lean production: The effect of contingencies. International Journal of Production Research, 54(8), 2433-2448. https://doi.org/10.1080/00207543.2015.1096976
Paais, M., y Pattiruhu, J. R. (2020). Effect of motivation, leadership, and organizational culture on satisfaction and employee performance. The Journal of Asian Finance, Economics and Business. 7(8), 577-588. https://doi.org/10.13106/jafeb.2020.vol7.no8.577
Padua, J. (2018). Técnicas de Investigación Aplicadas a las Ciencias Sociales. Mexico City, México: FCE Fondo de Cultura Económica.
Pujol-Cols, L. (2018). Autoevaluaciones esenciales y autonomía: un estudio de sus efectos directos e interactivos sobre el entusiasmo laboral en profesionales argentinos. Estudios Gerenciales, 34(149), 361-372. https://doi.org/10.18046/j.estger.2018.149.2839
Quinn, R.E., y Cameron, K.S. (2019). Positive Organizational Scholarship and Agents of Change . Research in Organizational Change and Development, 27, 31-57. https://doi.org/10.1108/S0897-301620190000027004
Raykov, T., y Marcoulides, G. A. (2008). An Introduction to Applied Multivariate Analysis. Routledge. https://doi.org/10.4324/9780203809532
Robbins, S. P., y Coulter, M. K. (2004). Management (8ª Ed.). Prentice Hall.
Rockart, J.F. (1979). Chief Executives Define Their Own Data Needs. Harvard Business Review, 57, 81-93.
Rodrigues, F., Jacinto, M., Antunes, R., Amaro, N., Matos, R., y Monteiro, D. (2023). Analysis of Exercise Intensity Preferences, Tolerance, Competence, and Their Implications for Behavioral Intentions in Fitness Settings. Journal of Functional Morphology Kinesiology , 8(3), 139. https://doi.org/10.3390/jfmk8030139
Romero, J. (1 de enero de 2020). Prueba de Kaiser-Meyer-Olkin (KMO). R. Jeshua Romero Guadarrama. https://www.r-data-scientist.com/blog/statistical-tests/kaiser-meyer-olkin-test/
Schumacker, R., y Lomax, R. (2015). A Beginner's Guide to Structural Equation Modeling. Routledge. https://doi.org/10.4324/9781315749105
Snee, R. D., y Hoerl, R. W. (2003). Leading Six Sigma: A Step by Step Guide Based on Experience at GE and Other Six Sigma Companies. Upper Saddle River, NJ, USA: Prentice-Hall.
Soti, A., Shankar, R., y Kaushal, O. (2010). Modeling the enablers of Six Sigma using interpreting structural modeling. Journal of Modeling and Management, 5(2), 124-141. http://dx.doi.org/10.1108/17465661011060989
Stellantis Corporation (2021). 2020 Sustainability Report. https://www.stellantis.com/content/dam/stellantis-corporate/sustainability/csr-disclosure/fca/fca_2020_sustainability_report.pdf
Tashakkori, A., y Teddlie, C. (2010). SAGE Handbook of Mixed Methods in Social & Behavioral Research.(2ª Ed.). SAGE Publications, Inc. https://doi.org/10.4135/9781506335193
Tuuli, M. y Rowlinson, S. (2009). Performance consequences of psychological empowerment. Journal of Construction Engineering and Management, 135(12), 1334-1347. https://doi.org/10.1061/(asce)co.1943-7862.0000103
Unilever (2022). Unilever Annual Report and Accounts 2022. https://www.unilever.com/files/92ui5egz/production/257f12db9c95ffa2ed12d6f2e2b3ff67db49fd60.pdf
Van-der-Hofstadt-Román, C. J., y Gómez-Gras, J.-M. (2006). Competencias y habilidades profesionales para universitarios. Madrid: Díaz de Santos.
Vara, A. H. (2012). Desde La Idea hasta la sustentación: Siete pasos para una tesis exitosa. Un método efectivo para las ciencias empresariales. Universidad de San Martín de Porres.
Vega, M., Fuentealba, N., y Patiño, L. (2016). Compromiso organizacional del funcionario municipal rural de la provincia de Ñuble, Chile. Ciencia & Trabajo, 18(56), 134-138. https://doi.org/10.4067/s0718-24492016000200010
Vila, S., Laguillo, A., y Faura, M. (2020). Ventajas organizacionales, económicas y sociales, derivadas de la aplicación de la subrogación de personal en el sector de la seguridad privada en España. Revista De Estudios Empresariales Segunda Época, 2, 134-152. https://doi.org/10.17561/ree.v2020n2.8
Villafuerte, F., y Lupano, M. L. (2020). Virtuosidad en organizaciones escolares asociada al liderazgo auténtico de sus autoridades. Revista Chakiñan de Ciencias Sociales y Humanidades, 11, 57-69. https://doi.org/10.37135/chk.002.11.04
Villarruel, A. (2021). Liderazgo en enfermería: ¡Es hora de dar un paso al frente! Enfermería Universitaria, 18(1), 1-4. https://doi.org/10.22201/eneo.23958421e.2021.1.1156
Villegas, G.C. (2012). Gestión por factores críticos de éxito. Universidad EAFIT. https://repository.eafit.edu.co/items/d34d2ea3-6358-485b-a15a-833018fe6b8a
Vitaza, O. Z. (2020). Managerial Skills and Leadership Qualities for Competencies of Women Leaders in SUC’s and Private HEI’s in Calabarzon. International Journal of Advanced Research, 8(12), 283–288. https://doi.org/10.21474/ijar01/12149
Yaraghi, R., y Langhe, R. G. (2011). Critical success factors for risk management systems. Journal of Risk Research, 14(5), 551-581. https://doi.org/10.1080/13669877.2010.547253
Yamashina, H. (2000). Challenge to world‐class manufacturing, International Journal of Quality & Reliability Management, 17(2), 132-143. https://doi.org/10.1108/02656710010304546
Yamashina, H. (13 de noviembre del 2006). WCM – The Japanese Way. https://smeding.wordpress.com/2006/11/13/WCM-the-japanese-way-2/
Yamashina, H. (2009). World Class Manufacturing. https://wenku.baidu.com/view/07c001d2240c844769eaeea2.html
Yamashina H. (2013). World Class Manufacturing Plant Audit. https://wenku.baidu.com/view/1a69fbce5fbfc77da269b195.html